
What Is Technical Analysis?
Technical analysis attempts to understand the market sentiment behind price trends by looking for patterns and trends rather than analyzing a security’s fundamental attributes. First introduced by Charles Dow and the Dow Theory in the late 1800s, it is a trading discipline employed to evaluate investments and identify trading opportunities in price trends and patterns seen on charts. Technical analysis can be used on any security with historical trading data. This includes stocks, futures, commodities, fixed-income, currencies, and cryptocurrencies.
Learn more about the TOP chart patterns you MUST know for crypto technical analysis:
The Basics of Technical Analysis for Cryptocurrency Trading
Underlying Assumptions of Technical Analysis
Professional analysts typically accept three general assumptions for the discipline:
- The market discounts everything: Technical analysts believe that everything from fundamentals to broad market factors to market psychology are already priced into the price. The theory indicates that pricing in the market includes consideration of current, future, and past demand, regulations, expectations of traders, trader knowledge and so on.
- Price moves in trends: Technical analysts expect that price, even in random market movements, will exhibit trends regardless of the time frame being observed. In other words, price is more likely to continue a past trend than move erratically.
- History tends to repeat itself: Technical analysts believe that indicators and patterns tends to repeat themself. The repetitive nature of price movements is often attributed to market psychology, which tends to be very predictable based on emotions like fear or excitement.
Best Chart for Technical Analysis – Candlestick Charts
Charts are graphical presentations of price information of assets over time. Charts plot historical data based on a combination of price, volume and time intervals. Main chart types used by technical analysts are the line chart, bar chart, candlestick chart, Renko Chart, Point-and-Figure charts, etc. The most popular of these is the candlestick chart.
Candlestick charts originated in Japan over 100 years before the West developed the bar and point-and-figure charts. The name candlestick comes from the fact that each plot point on the graph is like a candlestick. The top and bottom of the candlestick’s main rectangle are at the opening and closing prices of the day. Green candlesticks indicate that the asset rose in value so the opening price is at the bottom and the closing price is at the top. Red candlesticks indicate a fall in price, so the opening price is at the top and the closing price is at the bottom. The wicks on either end of the candle show the lowest and highest prices within the same period. In other words, the wicks give you an idea of market volatile.

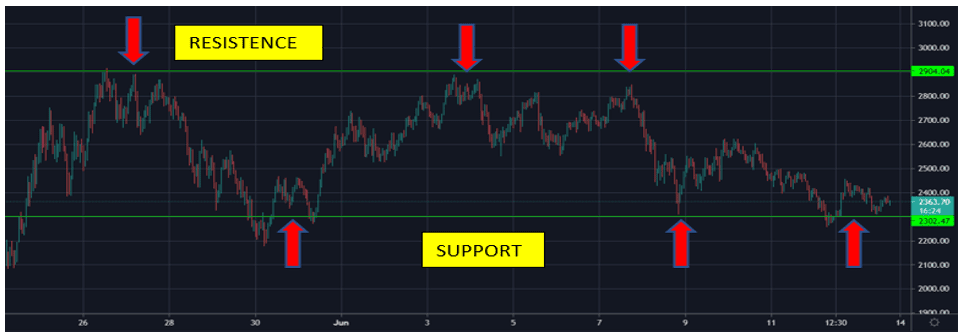
Understanding Support and Resistance levels
Support refers to the level at which an asset’s price stops falling and bounces back up. Resistance is where the price usually stops rising and dips back down. An asset’s price might be rising because demand is outstripping supply. However, the price will eventually reach the maximum that buyers are willing to pay, and demand will decrease at that price level. At this point, buyers might decide to close their positions. This creates resistance, and the price starts to fall as supply begins to outstrip demand. Once an asset’s price falls enough, buyers might buy back into the market because the price is now more acceptable, creating a level of support where supply and demand begin to equal out. Once price breaks through a level of resistance, it may become a level of support and as price breaks below the support, it may become a level of resistance. Below is a chart of Ethereum demonstrating classic support/resistance characteristics:
How to Choose Time Frames
It is possible to set your own time frames on the price chart. Some common options include 15 minutes, hourly, four hours, and daily charts, although there are numerous other options available as well. Time frame are selected based on the style of trading a trader follows.
- Intra-day or short-term traders tend to open and close positions all within one day. Common choices for intra-day traders include five minutes, 15 minutes, and an hour.
- Long-term traders hold positions over a much longer period of time, which may be weeks, months, or even years. Long-term cryptocurrency traders look at larger time periods, such as four-hour, daily, or weekly charts.
Building a Trading Toolkit
Trading indicators are mathematical calculations, which are plotted as lines on a price chart and can help traders identify certain signals and trends within the market. They are used by traders to gain insight into the supply and demand of securities and market psychology. Together, these indicators form the basis of technical analysis. Traders often use several different technical indicators in tandem when analyzing a chart and may also combine indicators to come up with trade ideas. There are different types of trading indicator, including leading indicators and lagging indicators. A leading indicator is a forecast signal that predicts future price movements, while a lagging indicator looks at past trends and indicates momentum.
Below are some of the top indicators used by technical analysts applied on the Bitcoin/USD chart:
1. Elliott Wave Theory
The Elliott wave principle is a form of technical analysis that finance traders use to analyze financial market cycles and forecast market trends by identifying extremes in investor psychology, highs and lows in prices, and other collective factors. Ralph Nelson Elliott (1871–1948), a professional accountant, discovered the underlying social principles and developed the analytical tools in the 1930s. He proposed that market prices unfold in specific patterns, which practitioners today call Elliott waves, or simply waves.
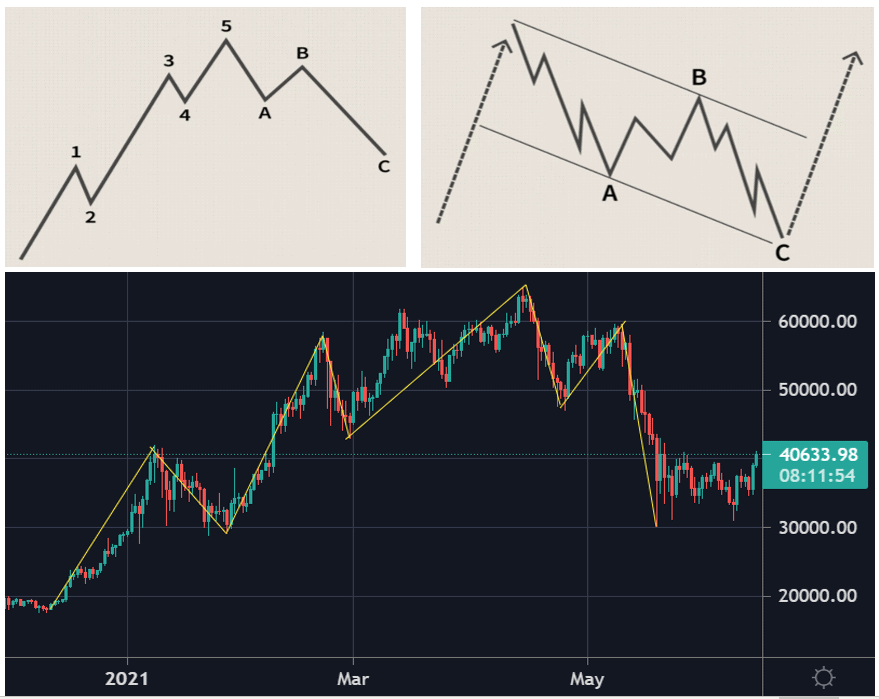
Impulses are always subdivided into a set of five lower-degree waves, alternating again between motive and corrective character, so that waves 1, 3, and 5 are impulses, and waves 2 and 4 are smaller retraces of waves 1 and 3, respectively. Corrective waves subdivide into three smaller-degree waves starting with a five-wave counter-trend impulse, a retrace, and another impulse. In a bear market, the dominant trend is downward, and the pattern is reversed—five waves down and three up. Motive waves always move with the trend, while corrective waves move against it. Elliott made detailed stock market predictions based on reliable characteristics he discovered in the wave patterns.
Let’s have a look at the following chart made up of eight waves (five net up and three net down) labeled 1, 2, 3, 4, 5, A, B, and C. Waves 1, 2, 3, 4 and 5 form an impulse, and waves A, B and C form a correction. The five-wave impulse, in turn, forms wave 1 at the next-largest degree, and the three-wave correction forms wave 2 at the next-largest degree. The corrective wave normally has three distinct price movements – two in the direction of the main correction (A and C) and one against it (B). Waves 2 and 4 in the above picture are corrections.
The Elliott wave theory can be very helpful in Bitcoin and cryptocurrency trading. This is because crypto trading does, for many people involve a constant emotional and psychological back-and-forth.
2. Fibonacci Retracements and Fibonacci Ratios?
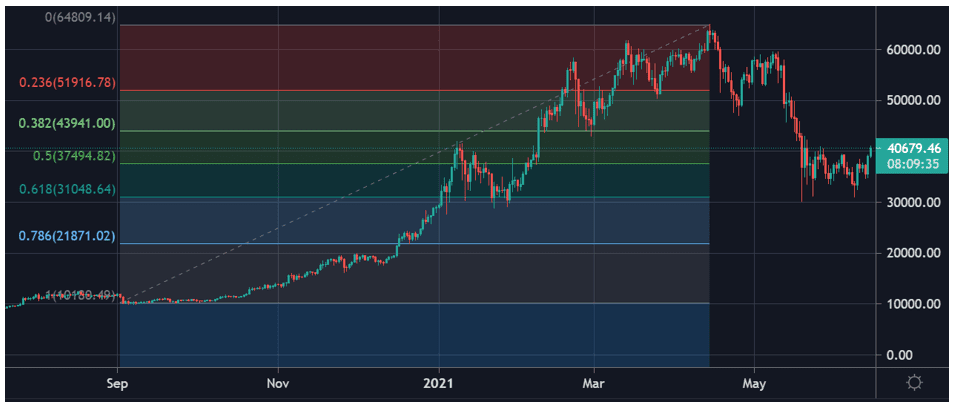
Fibonacci retracements are based on the key numbers identified by mathematician Leonardo Fibonacci in the 13th century. The Fibonacci sequence of numbers is as follows: 0, 1, 1, 2, 3, 5, 8, 13, 21, 34, 55, 89, 144, etc. Each term in this sequence is simply the sum of the two preceding terms, and the sequence continues infinitely. One of the remarkable characteristics of this numerical sequence is that each number is approximately 1.618 times greater than the preceding number. This common relationship between every number in the series is the foundation of the ratios used by technical traders to determine retracement levels.
In technical analysis, a Fibonacci retracement is created by taking two extreme points (usually a peak and a trough) on a price chart and dividing the vertical distance by the key Fibonacci ratios of 23.6%, 38.2%, 50%, 61.8%, and 100%. Once these levels are identified, horizontal lines are drawn and used to identify possible support and resistance levels. Technical traders attempt to use them to determine critical points where an asset’s price momentum is likely to reverse. Fibonacci retracements are the most widely used of all the Fibonacci trading tools. That is partly because of their relative simplicity and partly due to their applicability to almost any trading instrument. Most modern trading platforms contain a tool that automatically draws in the horizontal lines.
3. Moving Average (MA)
The MA or Simple Moving Average (SMA) – is an indicator used to identify the direction of a current price trend, without the interference of shorter-term price spikes. The MA indicator combines price points of a financial instrument over a specified time frame and divides it by the number of data points to present a single trend line. The data used depends on the length of the MA. For example, a 200-day MA requires 200 days of data. By using the MA indicator, you can study levels of support and resistance and see previous price action (the history of the market).
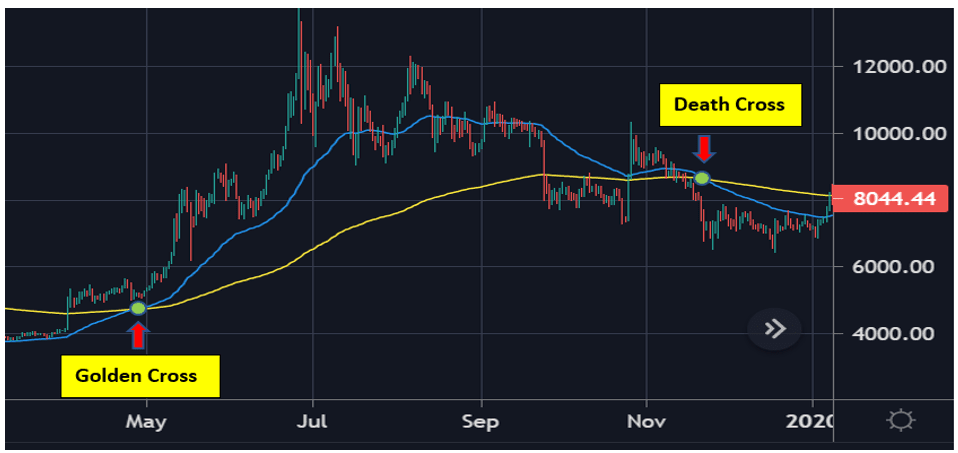
Exponential moving average (EMA) is another form of moving average. Unlike the SMA, it places a greater weight on recent data points, making data more responsive to new information. When used with other indicators, EMAs can help traders confirm significant market moves and gauge their legitimacy. The most popular exponential moving averages are 12- and 26-day EMAs for short-term averages, whereas the 50- and 200-day EMAs are used as long-term trend indicators. When the 50-day EMA crosses the 200-day EMA, this indicated the start of a bull trend and is known as a Golden Cross. On the other hand, when the shorter-term average cross over the longer-term average, this signifies a bearish change in trend commonly known as a Death Cross.
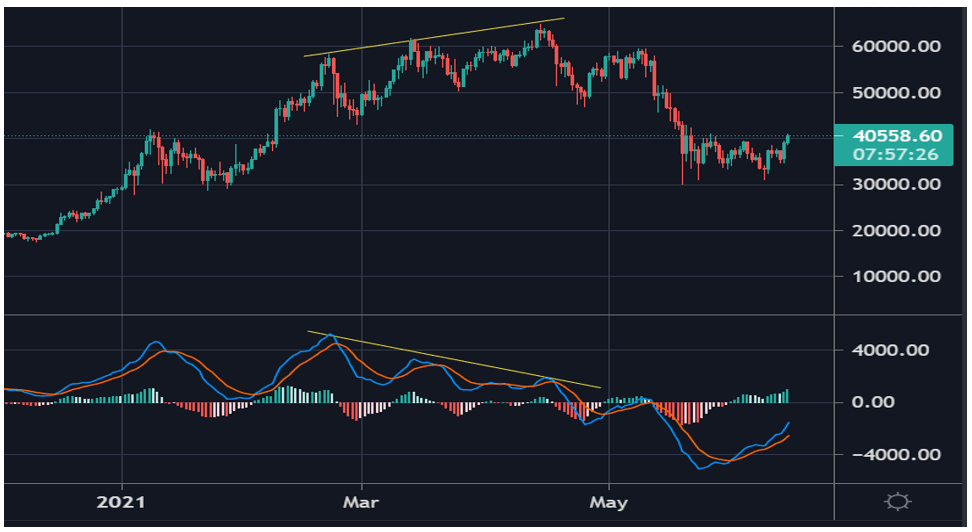
4. Moving Average Convergence Divergence (MACD)
The moving average convergence divergence (MACD) indicator helps traders see the trend direction, as well as the momentum of that trend. It can help traders identify possible buy and sell opportunities around support and resistance levels. ‘Convergence’ means that two moving averages are coming together, while ‘divergence’ means that they’re moving away from each other. If moving averages are converging, it means momentum is decreasing, whereas if the moving averages are diverging, momentum is increasing.
When the MACD is above zero, the price is in an upward phase. If the MACD is below zero, it has entered a bearish period. The indicator is composed of two lines, the MACD line and a signal line, which moves slower. When MACD crosses below the signal line, it indicates that the price is falling. When the MACD line crosses above the signal line, the price is rising. Looking at which side of zero the indicator is on aids in determining which signals to follow. For example, if the indicator is above zero, watch for the MACD to cross above the signal line to buy. If the MACD is below zero, the MACD crossing below the signal line may provide the signal for a possible short trade.
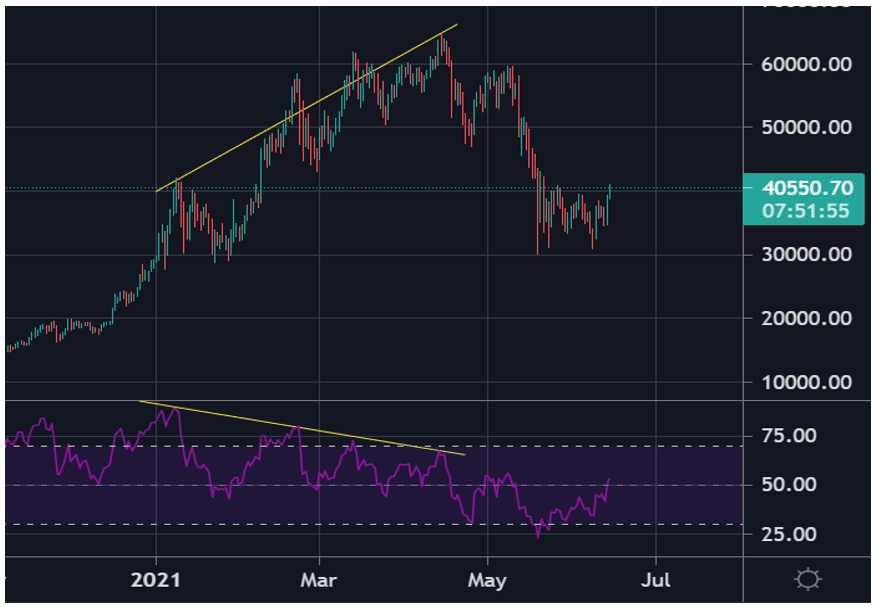
5. Relative Strength Index (RSI)
Most charting programs will also include Relative Strength Index or RSI indicator which can range anywhere from 0 to 100.
- The most basic use of an RSI is as an overbought and oversold indicator. When RSI moves above 70, the asset is considered overbought and could decline. When the RSI is below 30, the asset is oversold and could rally.
- Divergence is another use of the RSI. When the indicator is moving in a different direction than the price, it shows that the current price trend is weakening and could soon reverse.
- A third use for the RSI is support and resistance levels. During uptrends, a stock will often hold above the 30 level and frequently reach 70 or above. When a stock is in a downtrend, the RSI will typically hold below 70 and frequently reach 30 or below.
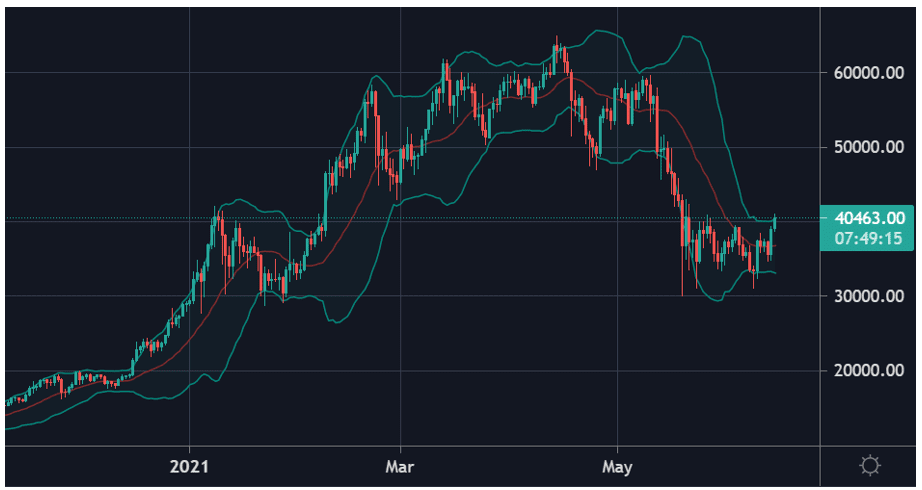
6. Bollinger Bands
A Bollinger band is an indicator that provides a range within which the price of an asset typically trades. The width of the band increases and decreases to reflect recent volatility. The closer the bands are to each other, the lower the perceived volatility of the financial instrument. The wider the bands, the higher the perceived volatility.
Bollinger bands are useful for recognizing when an asset is trading outside of its usual levels and are used mostly as a method to predict long-term price movements. When a price continually moves outside the upper parameters of the band, it could be overbought, and when it moves below the lower band, it could be oversold.
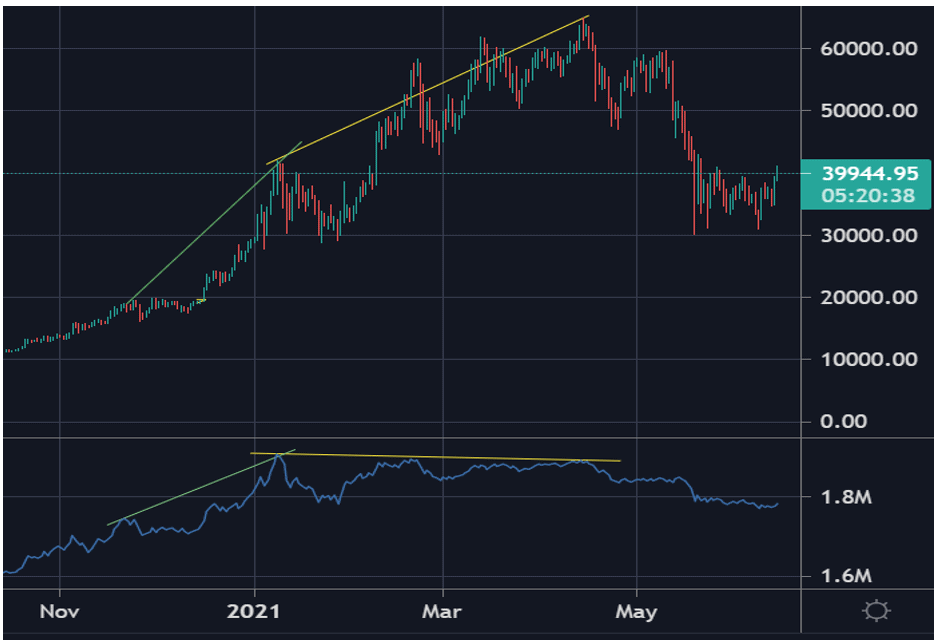
7. On-Balance Volume (OBV)
The OBV indicator is a running total of up volume minus down volume. Up volume is how much volume there is on a day when the price rallied. Down volume is the volume on a day when the price falls. Each day volume is added or subtracted from the indicator based on whether the price went higher or lower.
Traders use the OBV indicator to measure the positive and negative flow of volume in a security over time. When OBV is rising, it shows that buyers are willing to step in and push the price higher. When OBV is falling, the selling volume is outpacing buying volume, which indicates lower prices. In this way, it acts like a trend confirmation tool. If price and OBV are rising, that helps indicate a continuation of the trend. Traders who use OBV also watch for divergence which occurs when the indicator and price are going in different directions. If the price is rising but OBV is falling, that could indicate that the trend is not backed by strong buyers and could soon reverse.
The Bottom Line
Technical analysis can give cryptocurrency traders insight into the past of a crypto, facilitating future predictions. Moreover, if you were to rely solely on technical analysis, you would not get any insight into sentiment or news, which are part of fundamental analysis. This is particularly problematic with cryptocurrency trading since factors like mining hash and regulations can have a significant impact on the coin’s price, which technical analysis doesn’t account for. Most charting software like Trading View have numerous technical analysis tools already built into it which you can supplement with your own strategies. However, you should never use an indicator in isolation or use too many indicators at once. Focus on a few that you think are best suited to what you’re trying to achieve.
Disclaimer: Cryptocurrency trading involves significant risks and may result in the loss of your capital. You should carefully consider whether trading cryptocurrencies is right for you in light of your financial condition and ability to bear financial risks. Cryptocurrency prices are highly volatile and can fluctuate widely in a short period of time. As such, trading cryptocurrencies may not be suitable for everyone. Additionally, storing cryptocurrencies on a centralized exchange carries inherent risks, including the potential for loss due to hacking, exchange collapse, or other security breaches. We strongly advise that you seek independent professional advice before engaging in any cryptocurrency trading activities and carefully consider the security measures in place when choosing or storing your cryptocurrencies on a cryptocurrency exchange.
 token airdrop guide: Airdrop confirmed!")
 token airdrop guide")
 token airdrop guide")